
Bharatiya Antiquity Map
A redesign of Rupa Bhaty's civilisational timeline — keeping the density that made it worth publishing while making it something a general reader can actually scan.
- Client
- Nilesh Oak
- Services
- Information Design, Editorial Design, Typography
- Channel
- Blue channel
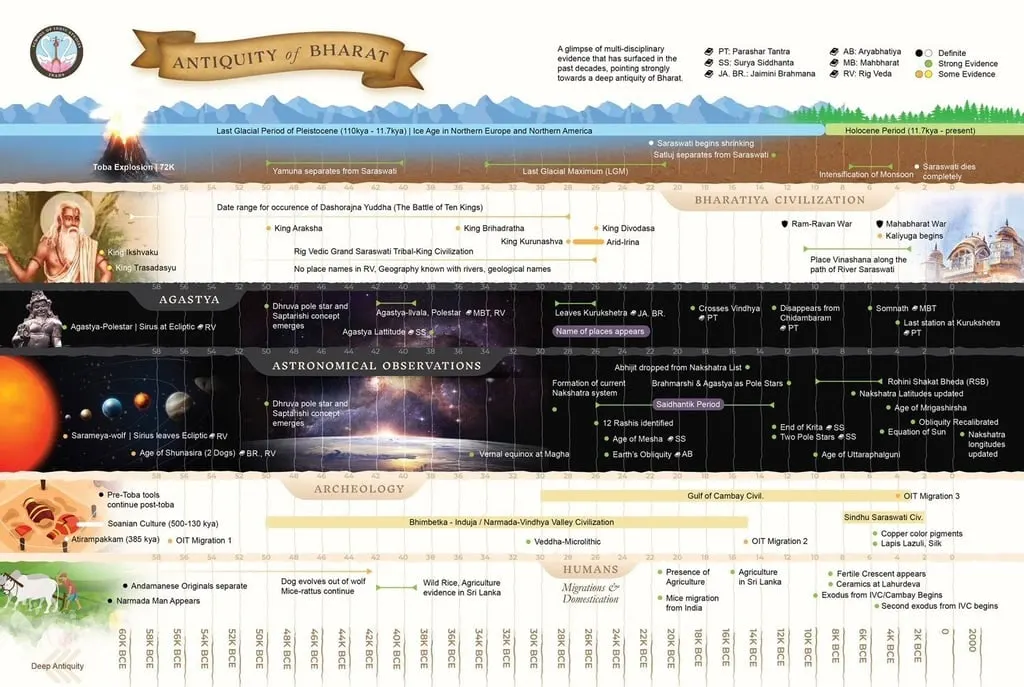
The chart
Every discipline dates ancient India in its own units, with its own error bars, in its own literature. This chart puts them on one sheet.
The brief
Rupa Bhaty’s original chart compressed historical, archaeological and scriptural data into a single unified timeline of India’s antiquity — but it was not readily accessible to a general audience. The chronology of ancient India is contested at its foundations, with competing frameworks differing by thousands of years: hydrology on the Saraswati, archaeoastronomy on the texts’ sky descriptions, stratigraphy, epigraphy, population genetics. Laying them over one another so the overlaps and the contradictions are both visible is the problem a chart like this exists to solve.
The approach
The chart’s value is its density, so the redesign had to keep the evidentiary chain intact while making it scannable. Working with Bhaty and under the researcher Nilesh Oak’s guidance, we organised India’s antiquity into legible layers of astronomical, archaeological, textual and epigraphic evidence.
The win
The redesigned chart appeared in MyIndMakers’ annual publication — scholarship that survived the redesign, and a general reader who can finally scan it.
The numbers
- Information design
- Format
- MyIndMakers annual
- Published in